Overview
The in-app Manifests report is a dashboard of important metrics on each supplier's performance, along with at-a-glance views on the number of items sent, average price per item, item acceptance rate, and sell-through percentages. For a detailed downloadable report, please review our help center guide to the Manifest Items report.
Table of Contents
How to Access Manifests Report
Manifests Report Dashboard Overview
Manifest Acceptance/Rejection Rate
How to Access Manifests Report
-
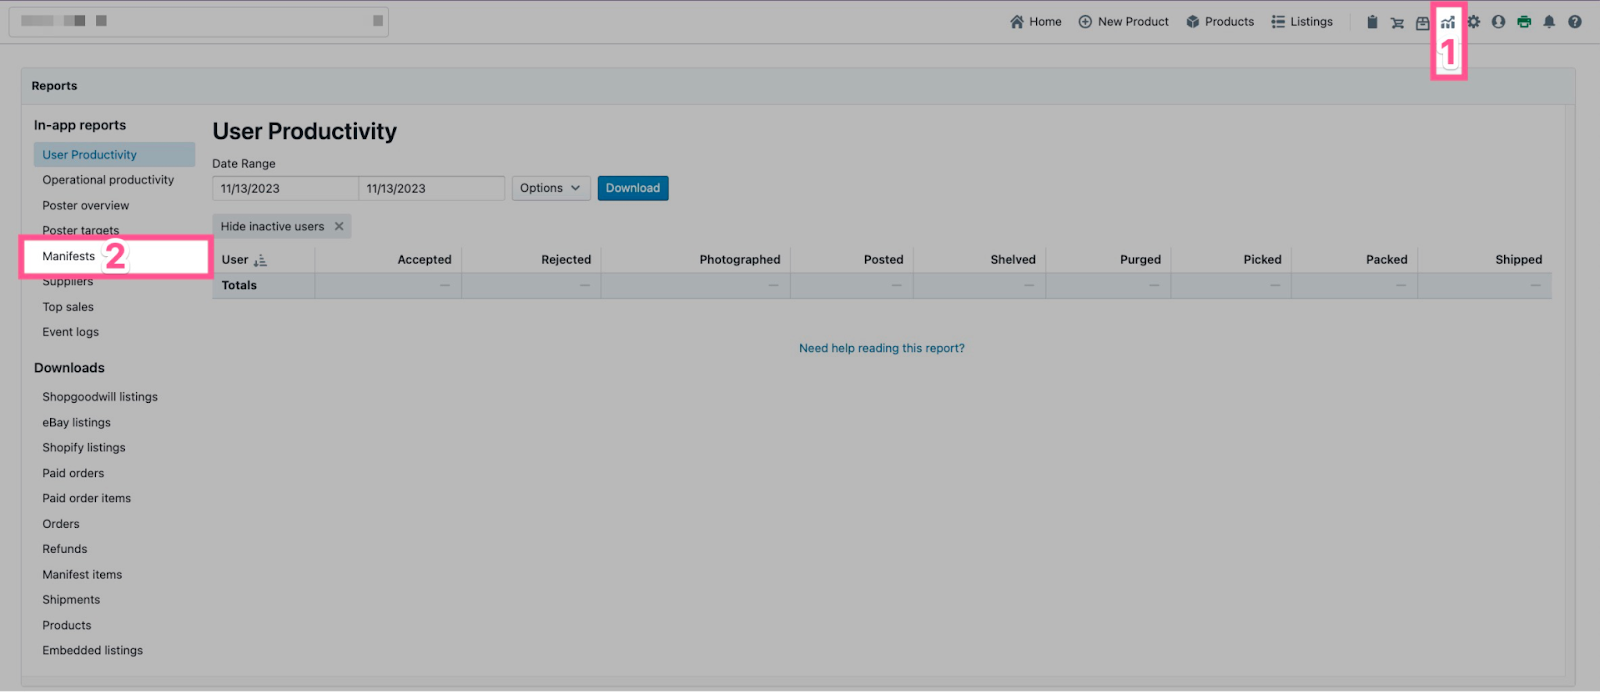
Click the Reports icon in the top right navigation bar in Lister
-
Click “Manifests” in the left navigation menu to open the report
Manifests Report Dashboard Overview
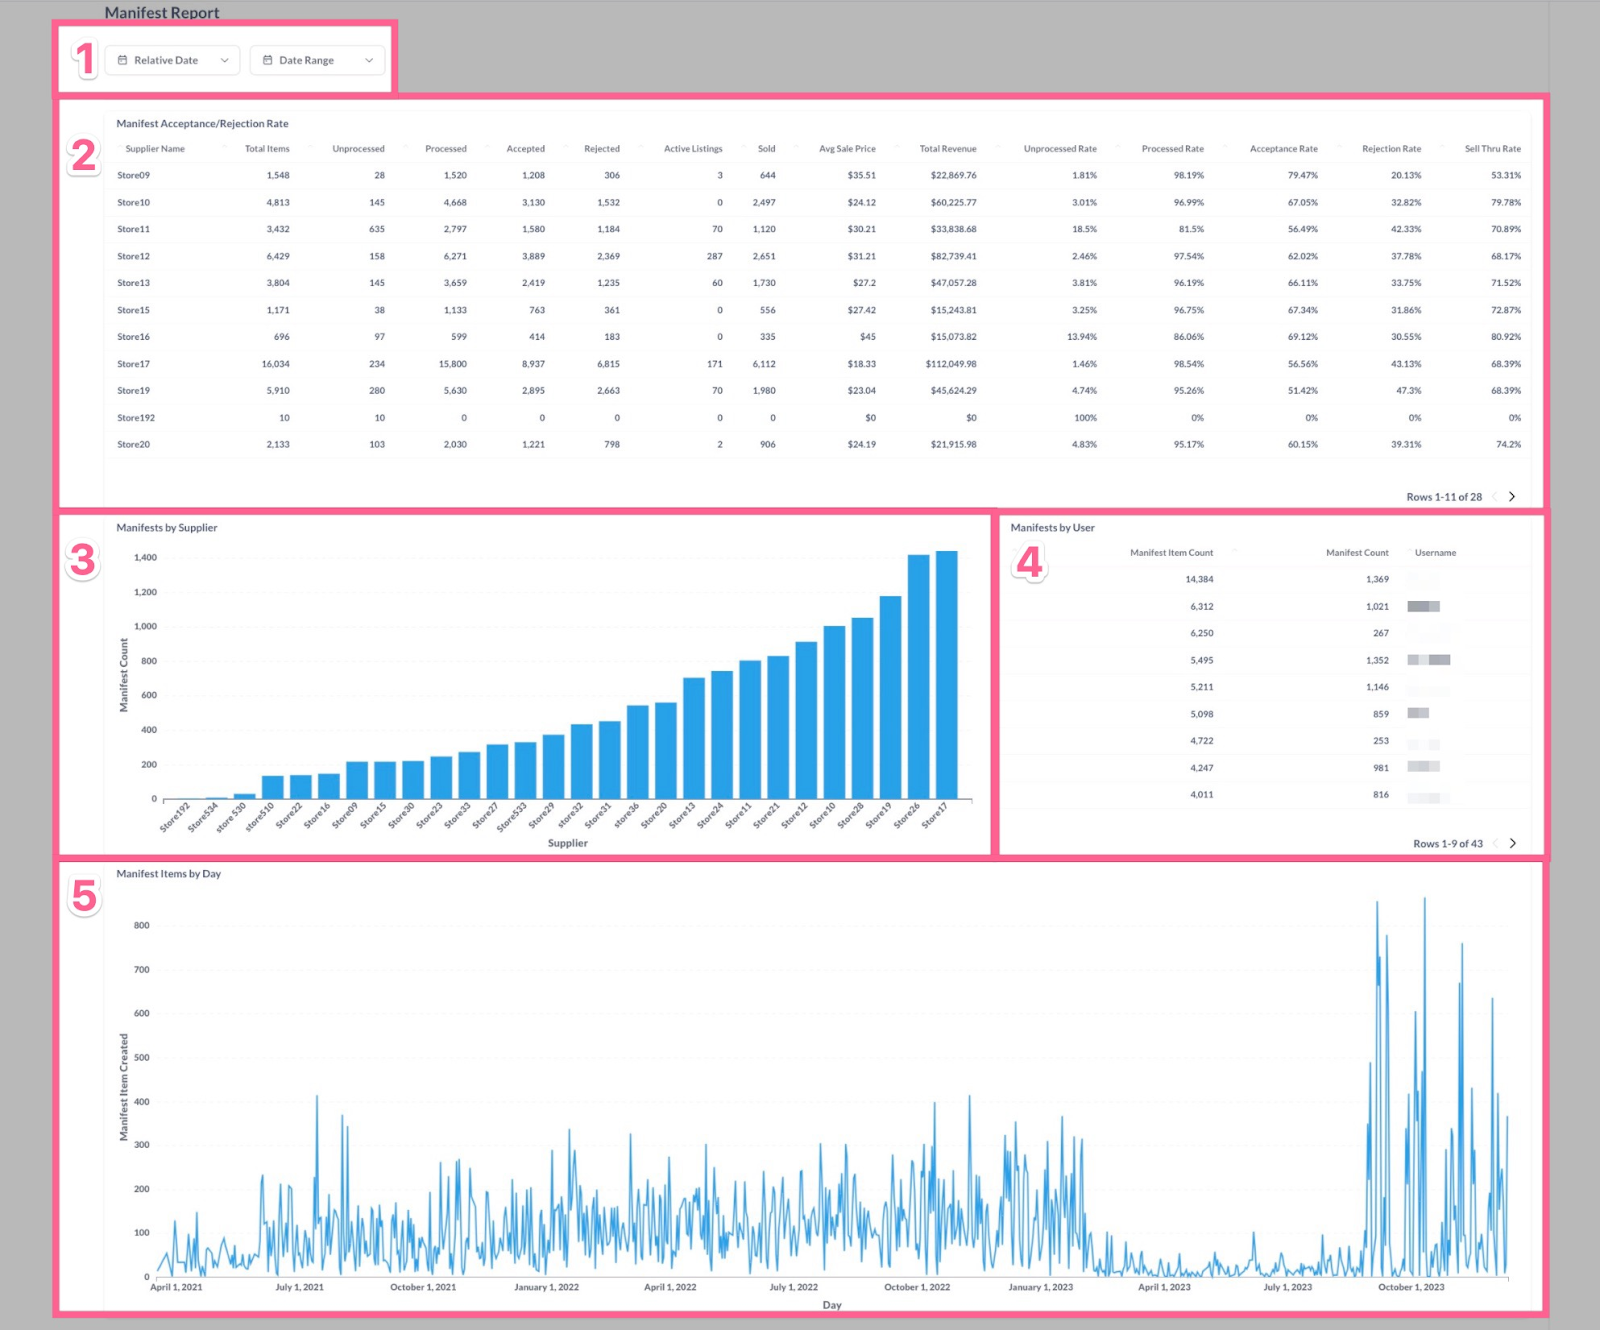
The Manifests dashboard is broken into 5 sections for reviewing various data points:
-
Relative Date and Date Range: Choose a predefined date range for or exact date range for the on-screen reports
-
Manifest Acceptance/Rejection Rate: Dashboard of each supplier’s total sent items, with additional metrics on average selling price and sell-thru rate
-
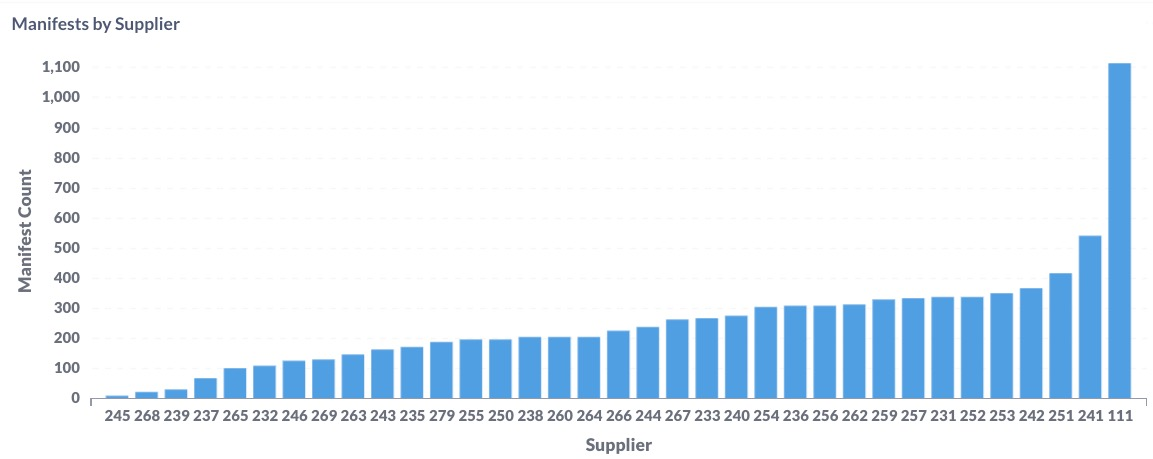
Manifests by Supplier: Bar chart of total manifest items sent per supplier
-
Manifests by User: Total count of manifest items created per teammate
-
Manifest Items by Day: Line chart visualizing how many manifest items are created per day
Relative Date and Date Range
-
Click the Relative Date menu to select a predefined date range for the report
-
Click the Date Range menu to select an exact timeframe for your report, then click “Update filter”
💡Operational Tip: The Relative Date and Date Range selectors are mutually exclusive. If you want to switch from one to the other, click the X icon to clear the selection. 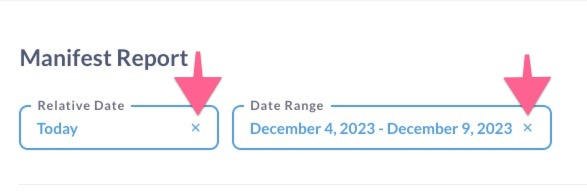
Manifest Acceptance/Rejection Rate
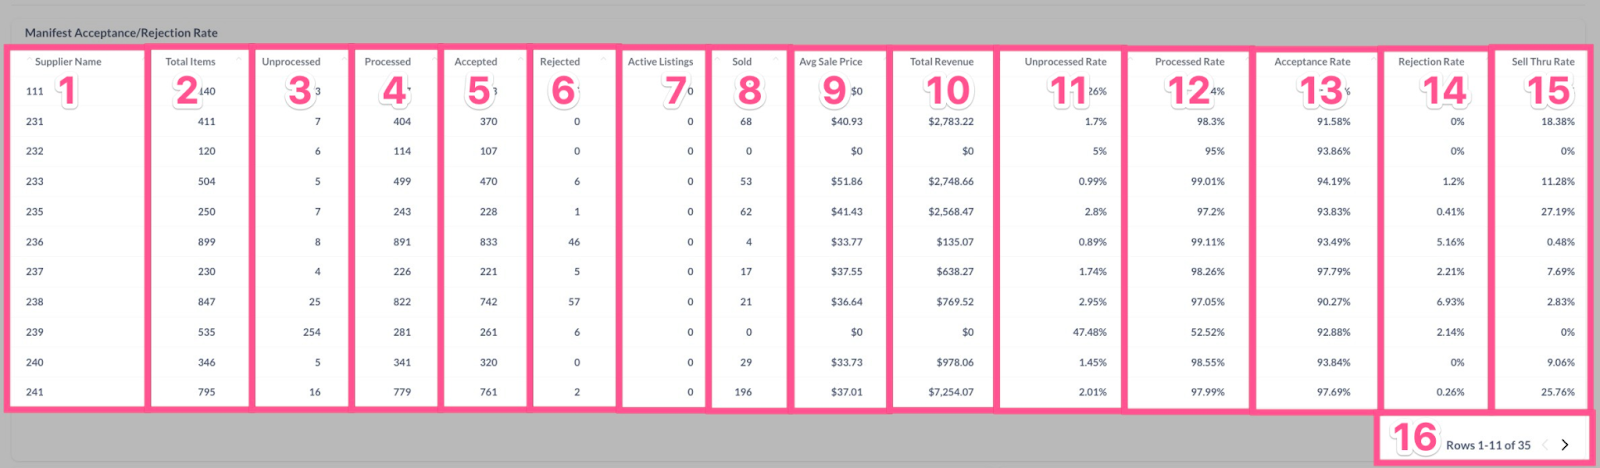
This dashboard provides the following information:
💡Operational Tip: Click any column header in the report to sort the data in ascending or descending order.
-
Supplier Name: Each row of data represents one supplier
-
Total Items: Total number of items manifested
-
Unprocessed: Total number of manifest items that have not been accepted or rejected. Includes Manifest items on hold
-
Processed: Total number of Manifest items that have been accepted and rejected
-
Accepted: Total number of items that have been accepted to sell online
-
Rejected: Total number of items that were rejected during manifest processing
-
Active Listings: Total number of items actively listed online
-
Sold: Total count of items that sold online
-
Avg Sale Price: Total revenue divided by Sold number
-
Total Revenue: Sum of all sold manifest items item prices. Does not include tax, shipping, etc
-
Unprocessed Rate: Percentage of manifest items that have not yet been accepted or rejected vs. Total Items
-
Processed Rate: Percentage of manifest items that were accepted or rejected vs. Total Items
-
Acceptance Rate: Percentage of manifest items that were accepted
-
Rejection Rate: Percentage of manifest items that were rejected
-
Sell Thru Rate: Percentage of accepted and listed items that ended with a sale
-
Rows: Click to show more data if you have more than 10 Suppliers
How to Download the Manifest Acceptance/Rejection Rate Report
-
Hover your mouse cursor over the top right section of report to reveal an action menu and click the menu icon
-
Click “Download results”
-
Click your preferred file type ( .csv, .xlsx, or .json)
Manifests by Supplier
This bar chart ranks your suppliers by total items manifested within your selected date range. This report provides a snapshot of your suppliers by overall activity level.
How to Download the Manifest by Supplier Report
-
Hover your mouse cursor over the top right section of report to reveal an action menu and click the menu icon
-
Click “Download results”
-
Click your preferred file type ( .csv, .xlsx, .json, or .png)
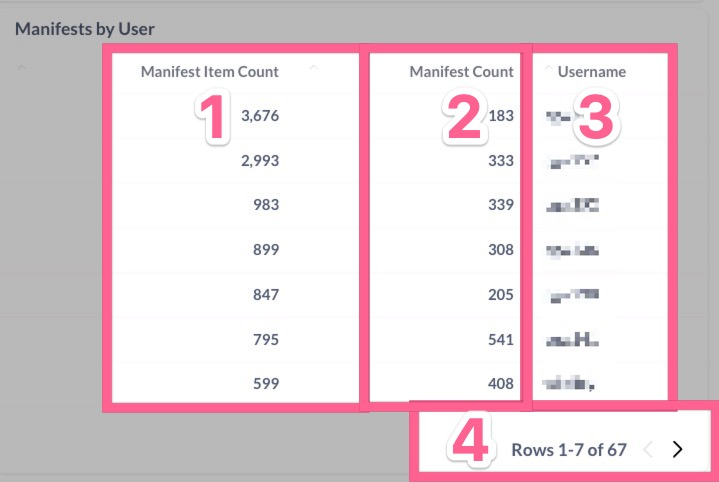
Manifests by User
This report ranks total items and manifests created by creators into a sortable table.
-
Manifest Item Count: Total number of items manifested
-
Manifest Count: Total number of manifests created
-
Username: Teammate who created manifests
-
Rows: Click to show more lines of data
Note: The numbers won't always match up between the Manifests by User report and the User Productivity Report. This is because Manifests by User is tracking created manifests and items, while User Productivity is tracking processed manifest items.
In other words, the Manifest Report shows you data based on the date the manifests were initially created. In contrast, the User Productivity Report shows data on when the items were processed.
How to Download the Manifest by User Report
-
Hover your mouse cursor over the top right section of report to reveal an action menu and click the menu icon
-
Click “Download results”
-
Click your preferred file type ( .csv, .xlsx, or .json)
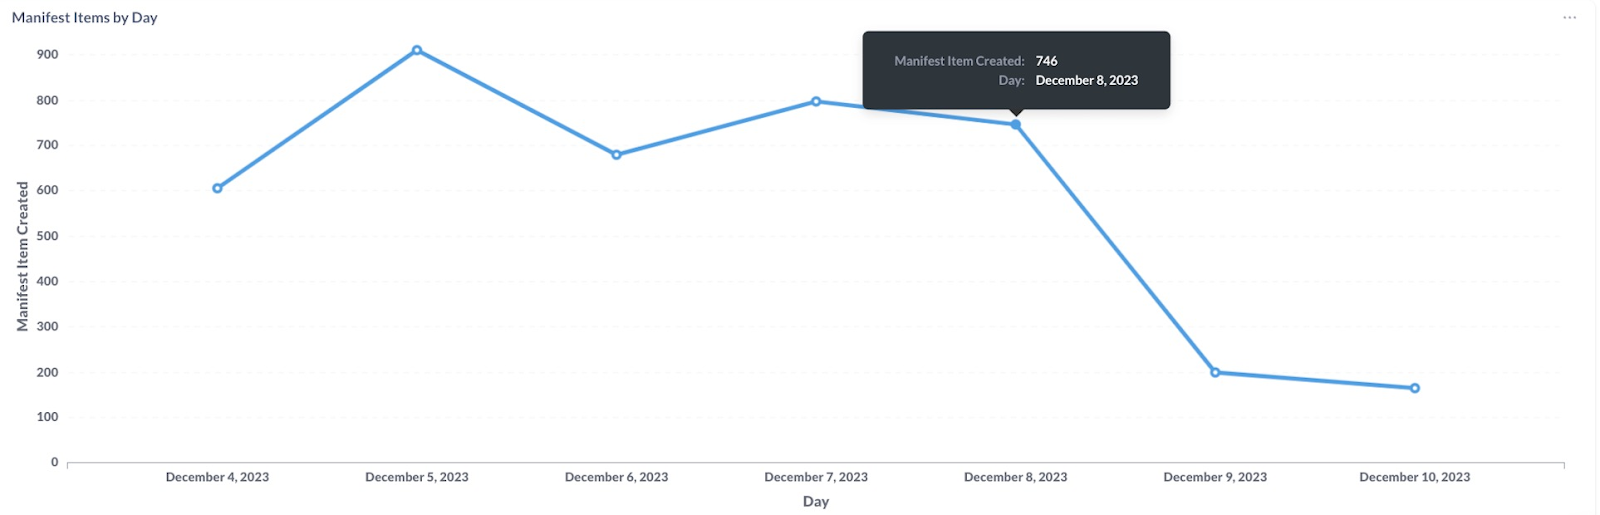
Manifest Items by Day
This line chart helps visualize how productive suppliers are per day in the total number of items manifested. This report helps identify if certain days are prone to lower manifest volumes and, therefore, if e-commerce can anticipate lower inbound volumes.
Hover your mouse over any datapoint in the chart to see more details about the given date.
How to Download the Manifest Items by Day Report
-
Hover your mouse cursor over the top right section of report to reveal an action menu and click the menu icon
-
Click “Download results”
-
Click your preferred file type ( .csv, .xlsx, .json, or .png)
Have questions? Reach out to us at support@uprightlabs.com or via chat anytime between 9am-6pm ET, Monday to Friday